- Stacking Insights
- Posts
- Stacking Insights - July 2025 Monthly Metrics
Stacking Insights - July 2025 Monthly Metrics
Highlighting key Bitcoin financial metrics for the month of July, 2025
Big Idea
We’re still at the very beginning of the bull market. Interest rate cuts have been delayed another month, institutional demand continues to grow, and on-chain metrics and global macro indicators signal early positive momentum for Bitcoin.
Key Metrics
Exchange Reserves hit new all time low: 2,374,561
Last month’s exchange reserves were measured at 2,469,890, showing a decrease of exchange reserves of ~95,300 BTC or ~$11B equivalent of BTC pulled into cold storage.
This new all time low signals that demand is pulling Bitcoin off of the exchanges into cold storage and are not short term traders.
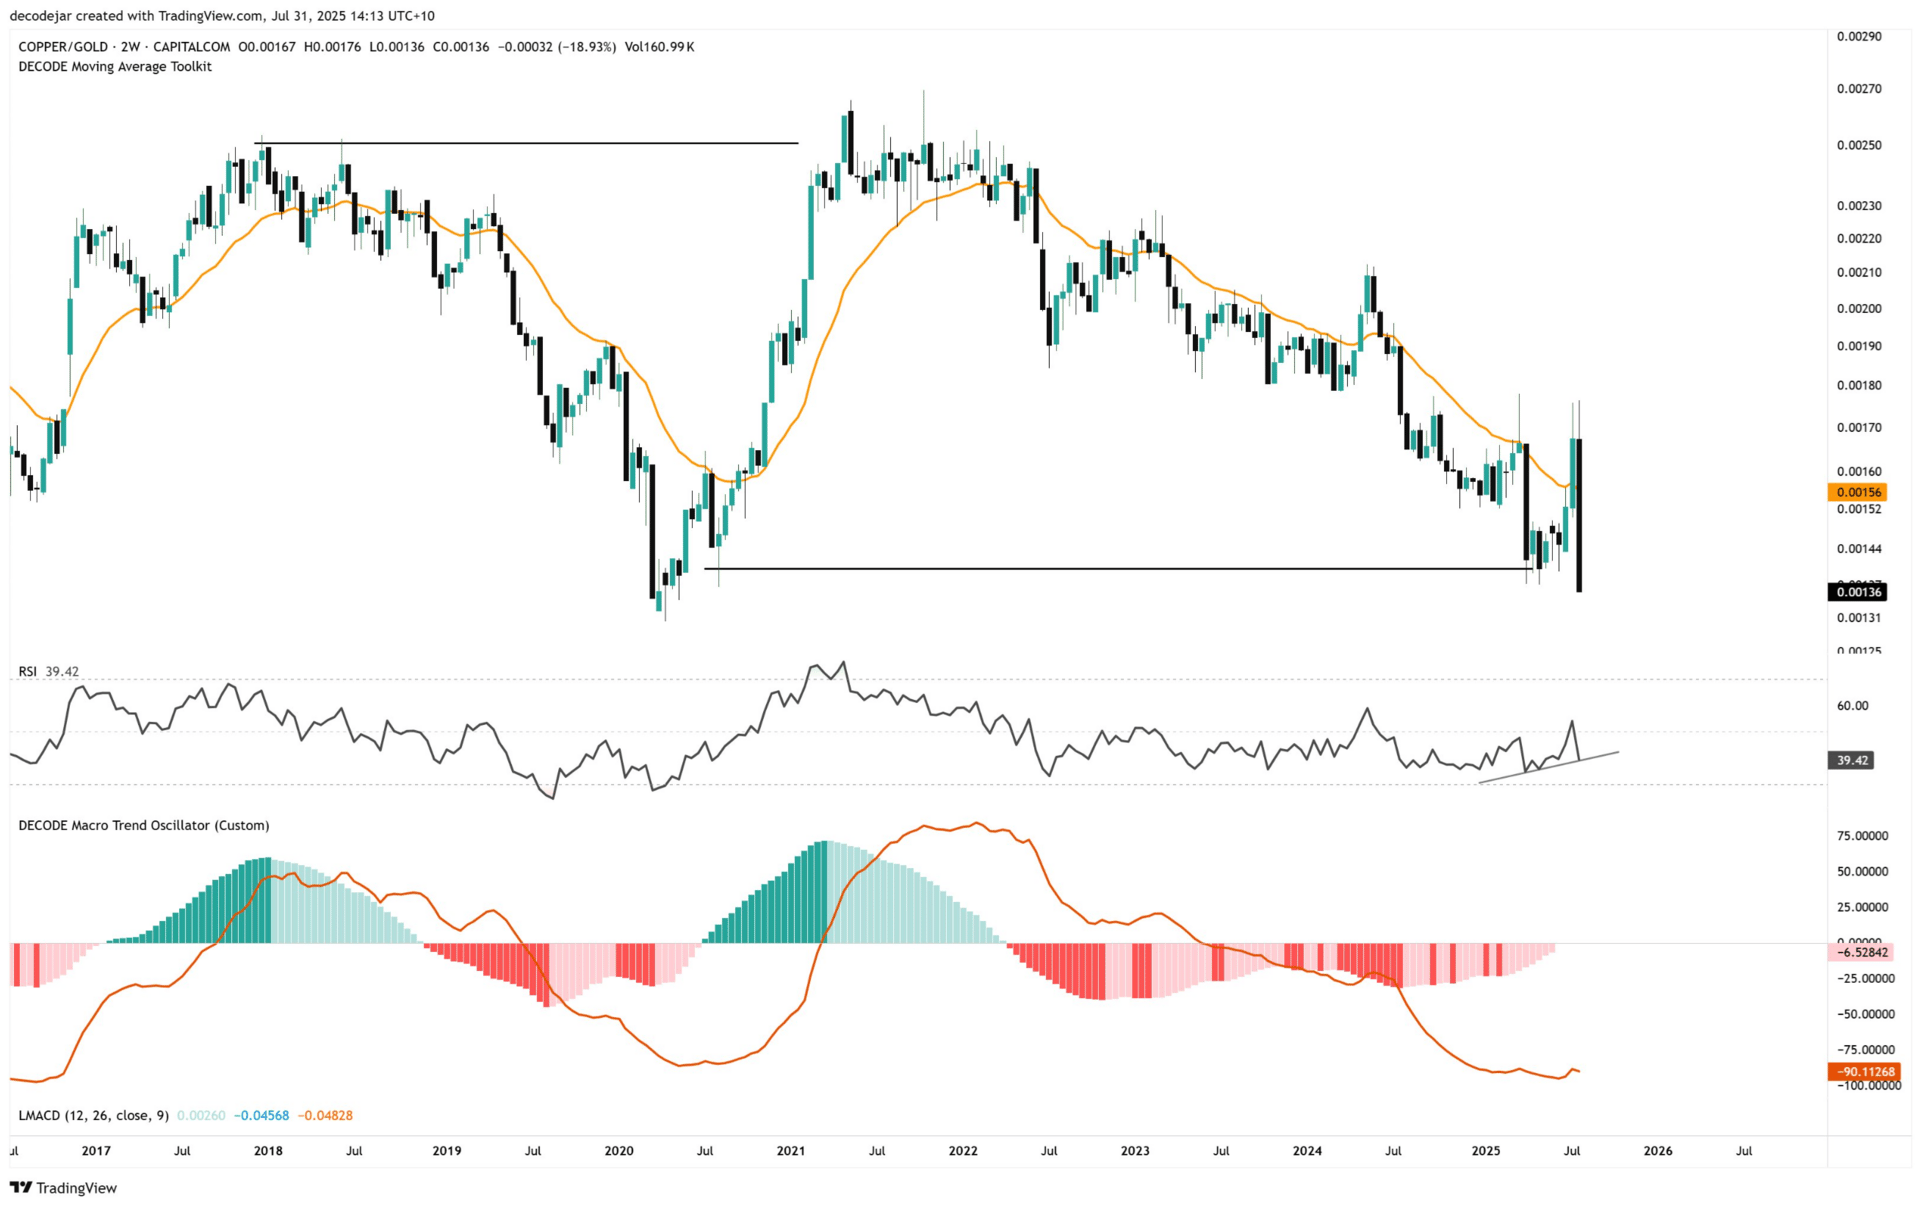
Copper / Gold Ratio retraces to new lows
The Copper/Gold ratio is a key macro indicator for industrial manufacturing optimism and growth as copper is a heavily used industrial commodity. When the Copper/Gold ratio is low, it means Gold price is increasing relative to gold, indicating investors are risk off and saving more. When copper price increases relative to gold, it signals additional manufacturing & industrial demand and growth optimism.
We can also see the updated Business Cycle below, continuing to turn slightly more positive.

200 Week Moving Average continues upward
The 200 week moving average reached $50,400 from $48,900, and signals continued upward momentum as Bitcoin previously peaks when the the 200 wma reaches the previous all time high.
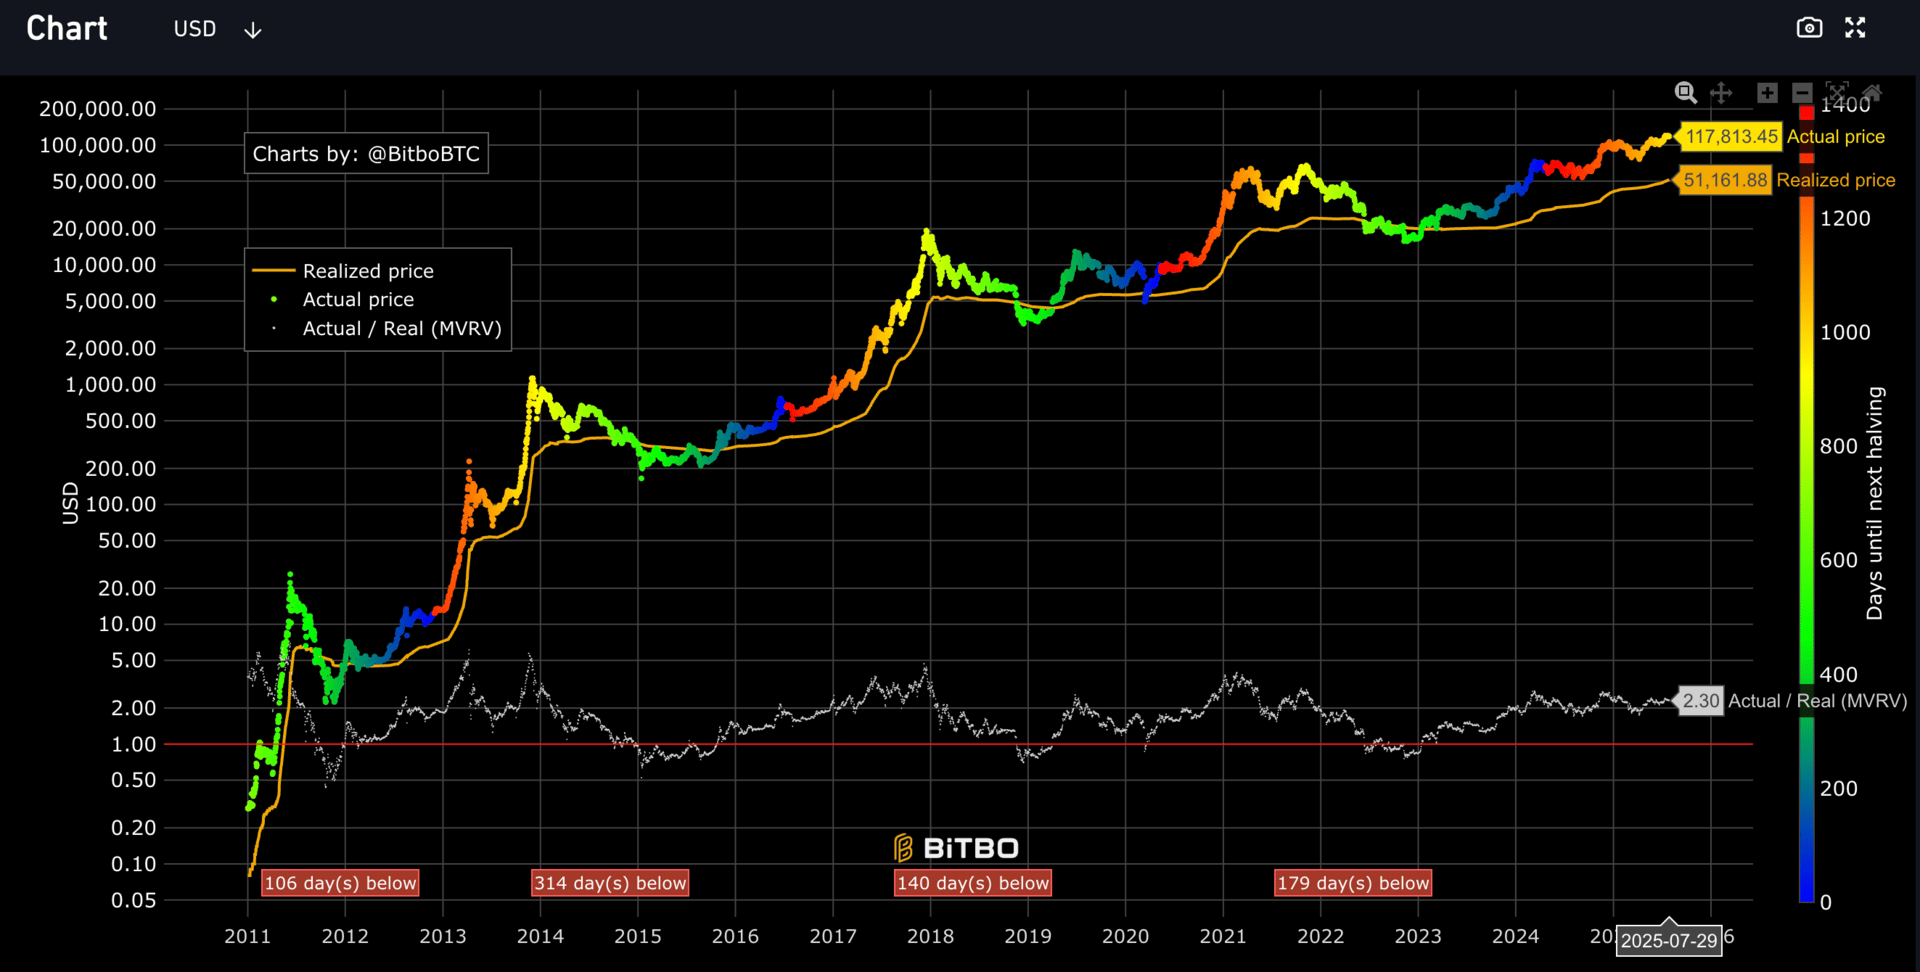
Bitcoin Realized Price breaks $51k
July realized price hits $51,160 from a previous high of $48k. Bitcoin realized price is the average price that each coin last moved at on the network. This value tends to set the floor and mirrors the 200wma, but indicates Bitcoin holders willingness to move and spend Bitcoin.
Bitcoin realized price has also signaled previous peaks when the realized price reaches peak price of previous cycle. For this cycle, realized price would need to reach ~$69k to signal the peak of the last cycle.
M2 Money Supply Expands by another ~$3T
After re-adjustment from a previous metrics, Global M2 has reached ~$109T from June of ~$106T. This highlights the continued increase in the global liquidity in the market.
This below graph shows M2 money supply shifted 12 weeks with a Bitcoin correlation of >0.9.
Bitcoin Relative Strength Index (RSI) increases by 4 points
July RSI is ending at 74 from 70 with an increase of ~4 points which correlates with the recent price increase. This increase in RSI continues to indicates that demand is positive, but not near price exhaustion peaks of prior cycles.
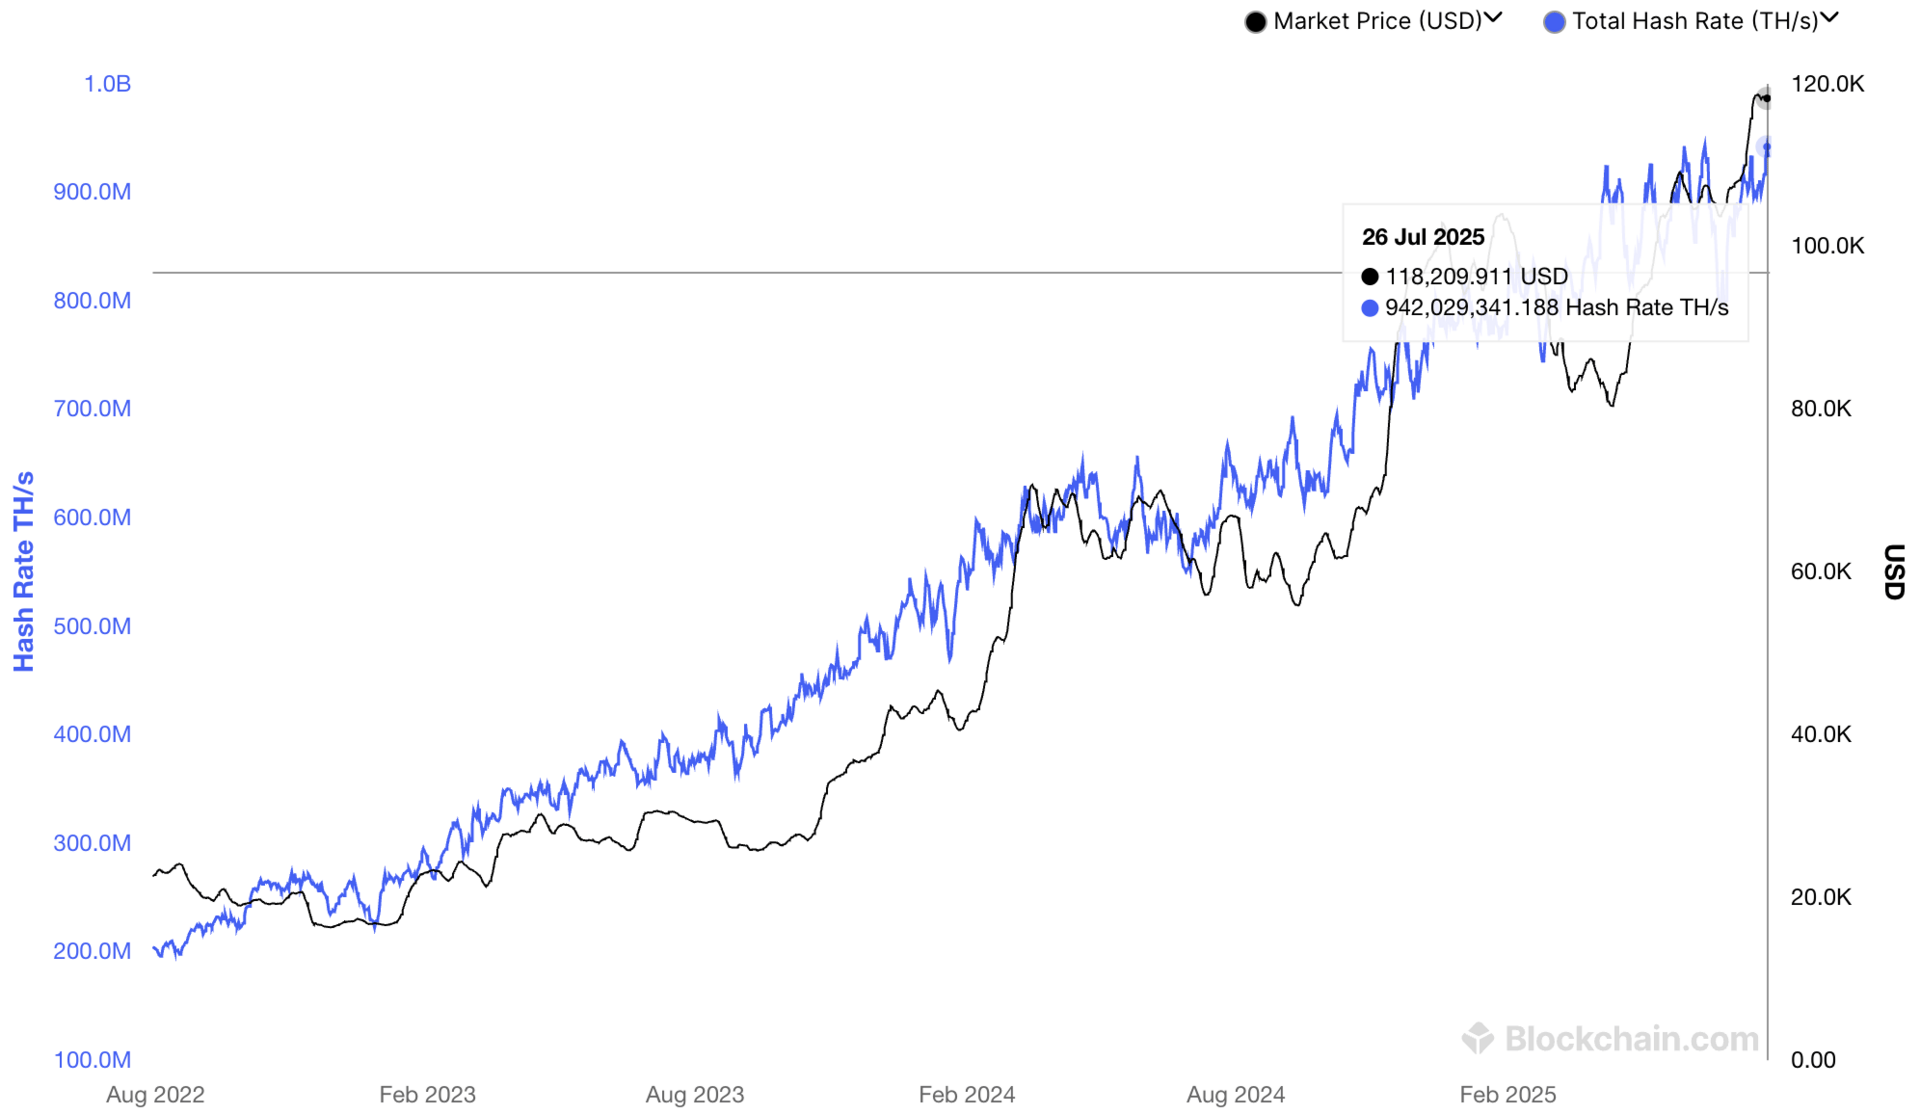
July Network Hashrate bounces back after drops amid heat waves in the US.
For July, Network Hashrate jumped back up to 942 exahash after a dip to the low 800 exahash as heat waves hit the north and miners are required to curtail from power demand. As the heat wave passed, miners turned back on, though we have
Bitcoin ETFs saw over $5B net positive inflows for July
That’s all for now.
If there are additional metrics that you want to see or think are appropriate to include, please let me know.
Thanks for reading.


